Posts

Showing posts from January, 2022

Implementing Datatables in Django

Image
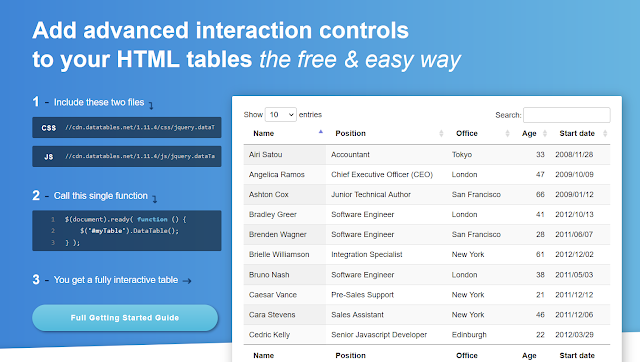
  DataTables is a plug-in for the jQuery Javascript library. It is a highly flexible tool, built upon the foundations of progressive enhancement, that adds all of these advanced features to any HTML table. I've been using this plug-in for almost every project that I'm involve with. It has a built-in search, sorting and pagination facility. Less hassle and simple to implement specially in dealing with huge datasets such as 100,000+ or even millions. It's UI can be in Bootstrap, among others. Implementing it in Django requires proper format, it should follow the required structure of JSON and the table itself. Django views.py and urls.py Create a function in views.py that will handle sorting, searching and pagination of your table. To start, In your HTML file. Some common error encountered is on columns, make sure the index are properly matched!

Creating heat map using GeoDjango

Image
  GeoDjango is a Django module that turns it into a web-GIS app. It is powerful as it uses geospatial engines such as GDAL, GEOS and PostGIS.  In this post, we'll be creating heat map using leaflet plugin https://github.com/Leaflet/Leaflet.heat . From our views.py , we need to create a function that can return JSON object with this format: [[ 50.5 , 30.5 , 0.2 ] , // lat, lng, intensity [ 50.6 , 30.4 , 0.5 ] , ] Below is an example: Basically, the proposed_roads query uses the Centroid function of GeoDjango, also intensity is obtain by getting the sum (change this depending on your specification or needs) based on the subquery. The output of this query is intensity and the Point object derived from Centroid which is named as "cent". To turn it into the desired format, we need to convert it into list and append the intensity (which is the 3rd value). The function returns a JSON data similar to the required format of leaflet heatmap. You can then use AJAX in

Auto-calculate your Splinterlands Assets/Income

Image
  Keep track of your Splinterlands assets or income by using this tool: http://kagkaghair.herokuapp.com/spl/calculate All you have to do is key in your username in Splinterlands.  The values are rough estimates only, exchange rates are fetch from coingecko and your DEC, CREDITS and CARDS are from Splinterlands API. The values are in PHP and computed using the following method: DEC value is computed by multiplying your DEC to its rate in peso. CARDS value is calculated by adding all your cards using the last price from the market (which is in dollar) then it is multiplied to dollar to peso exchange rate. SPS value is computed by multiplying your SPS to its rate in peso. CREDITS is computed by dividing it in 1000 and multiplying to dollar to peso exchange rate.

Rendering huge GeoJSON data using leaflet

Image
  Huge GeoJSON data may cause browser to crash, this is because of its limitations.  Let's say you have a 100+ MB file, displaying it on the map without map server will cause a lag or unresponsive browser. In order to address this issue, you can reduce the GeoJSON file size by simplifying its vertices using mapshaper (or using QGIS or any desktop GIS software) and converting it in TopoJSON . TopoJSON is an extension of GeoJSON that encodes topology. Rather than representing geometries discretely, geometries in TopoJSON files are stitched together from shared line segments called arcs . This technique is similar to Matt Bloch’s MapShaper and the Arc/Info Export format, .e00 . This will significantly reduce the file size, I have tried a 100+ MB file it reduces to 30+ MB. After the conversion, we'll be using a parser and rendering plugin for leaflet. Let's use leaflet-omnivore from mapbox in parsing TopoJSON and convert it to GeoJSON, then use Leaflet.VectorGrid . Here