I was born on 1989, grew up with this song on radio. Now, I'm 22. So, the title of this song is "Feel Like Dance". Yah, just until now I discover the title. Performed by the "globe".
About the song: Actually, this is the remix version of "Feel Like Dance" from their new album "house of globe". I provided a download link.
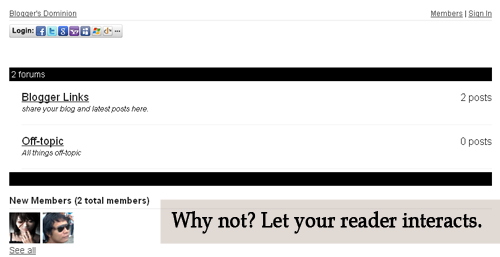
Let's see how it look like first. Is it good? Now, see it live. Click here . Then click the Forum Tab , wait 'til it loads. How to do it? Actually, it's very easy. 1. Just go to this site and sign-up. 2. Then go to your Blogger Dashboard > Edit Posts or New Posts > Edit Pages > Create New Page. 3. Name your page as Forum or anything you want. 4. Click Edit HTML 5. Paste the script that is given by tal.ki. The script looks like this. <script src='http://j9tjfgzo57.embed.tal.ki/embed/1.js' type='text/javascript'/><div id='j9tjfgzo57t4lk1prm0' style='font-size:80%; text-align:center;'>get your own <a href='http://tal.ki?utm_source=install&utm_medium=link&utm_campaign=get_your_own'>embeddable forum</a> with Talki</div> 6. Preview, if it's fine. Publish it! That's it!
Read the documentation of Bootstrap Multiselect . Anyway, just include all the files in you html page (head section), you will need these following files (JS and CSS files): //ajax.googleapis.com/ajax/libs/jquery/2.0.3/jquery.min.js http://maxcdn.bootstrapcdn.com/bootstrap/3.3.4/css/bootstrap.min.css http://maxcdn.bootstrapcdn.com/bootstrap/3.3.4/js/bootstrap.min.js https://dl.dropboxusercontent.com/u/75734877/bootstrap-multiselect.css https://dl.dropboxusercontent.com/u/75734877/bootstrap-multiselect.js Copy and save the files if you want to serve it with your own, and use it like this in your template: <script type="text/javascript" src="{% static "js/bootstrap-multiselect.js" %}"></script> Then refer to this JSFiddle for demo. Let's say you have this select element in your page with the id, "bldg_type" <select class="form-control" id="bldg_type" multiple="multiple">...
The code below automatically loads the shapefile found in a certain directory into a PostgreSQL database within a given interval(in this example 2 minutes). Downside (in which I'm trying to figure out): What if the filename of the shapefile changes? Anyway, this suits of what I need right now. __author__ = 'Matt' import os from django.db import connection from django.contrib.gis.utils import LayerMapping from .models import FloodHazard import datetime import time import logging from apscheduler.scheduler import Scheduler logging.basicConfig() # Start the scheduler sched = Scheduler() sched.daemonic = False sched.start() #ogrinspect evidensapp/data/flood_hazard/FloodHazard.shp FloodHazard --srid=32651 --mapping --multi # Auto-generated `LayerMapping` dictionary for FloodHazard model floodhazard_mapping = { 'hazard': 'Hazard', 'date_field': 'Date_', 'geom': 'MULTIPOLYGON' } bound_shape = os.path.abspath(os....



Comments
Post a Comment
Feel free to ask, suggest and comment regarding this post/blog. You can also contact me through e-mail, just always use the contact page. Thank you for visiting this blog.